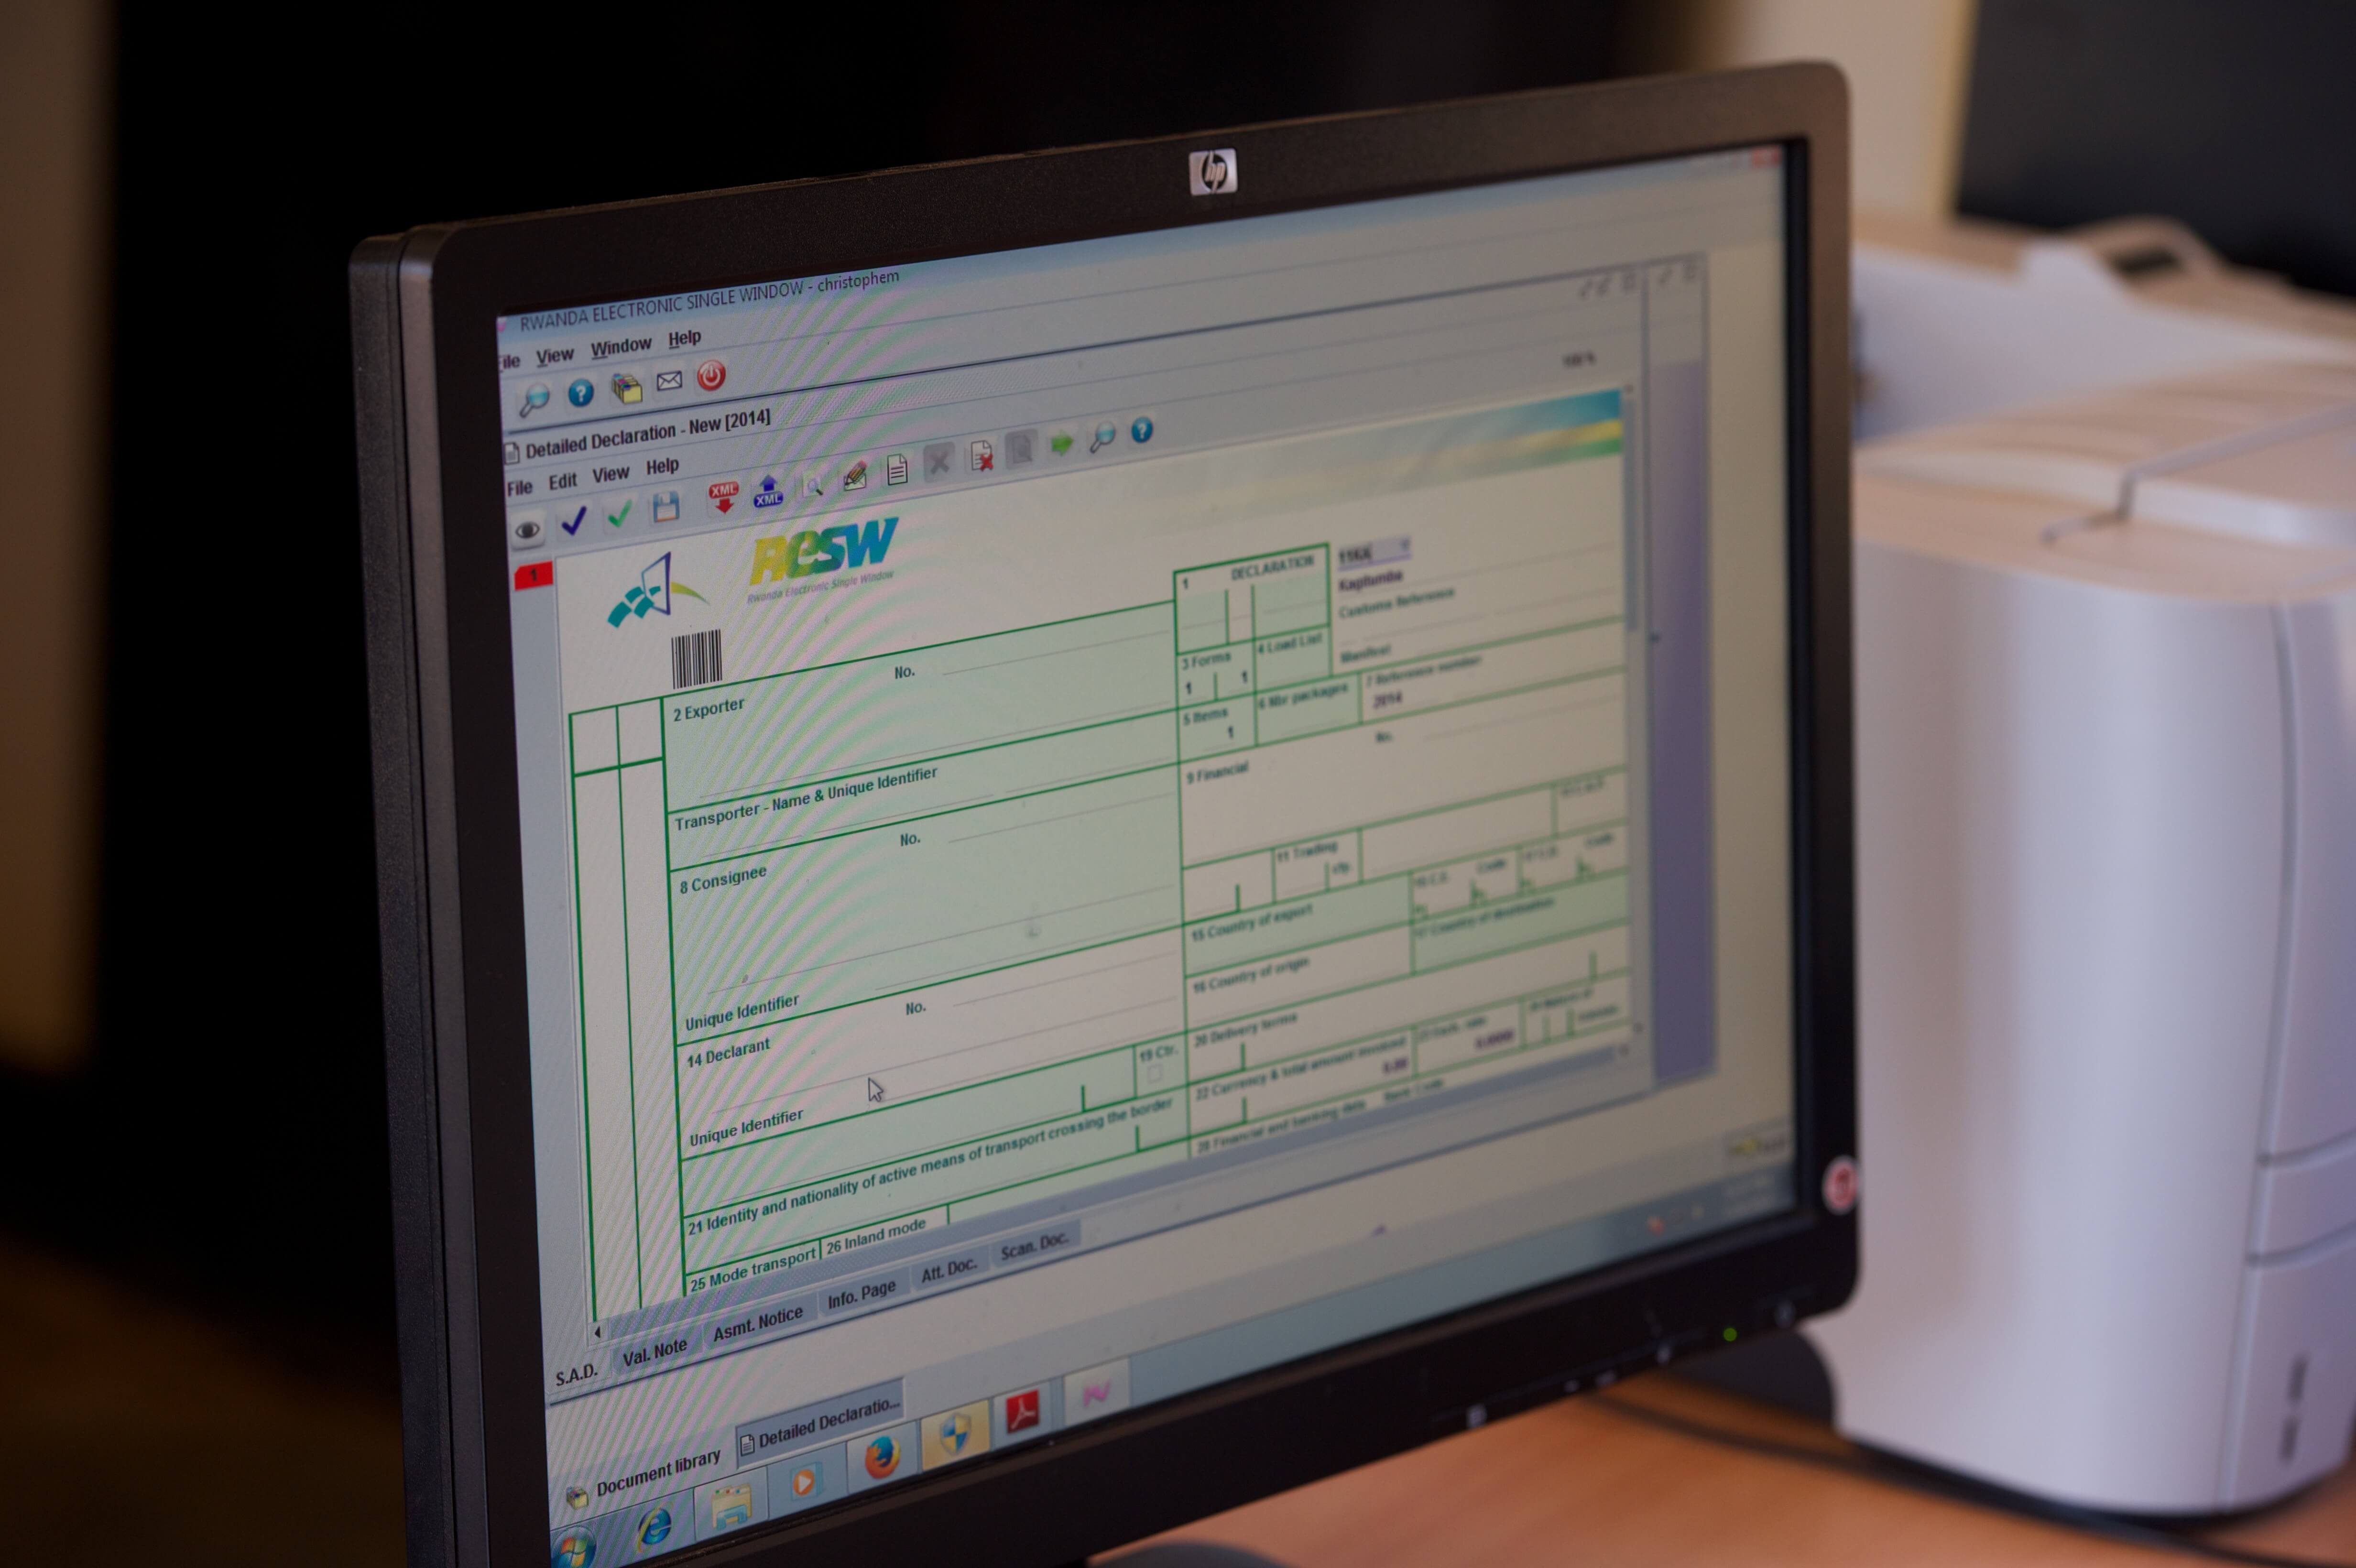
Section 5.2 of the report provided a detailed analysis of the average release times of imports and exports for the 2010-2014 period. In addition, it identified the release times for the various stages; some of these changes can be attributed to the ReSW, others are the result of other reform measures identified in the report. These data highlight progress as well as outstanding issues that can guide RRA in further streamlining its operations and extracting more benefits from the ReSW platforms o as to further better serve the trading community by reducing these times. These finding provide more information that has so far been used to monitor the progress of the ReSW and can be updated regularly with minor effort.
In addition, the table below provides information on standard deviations for the overall time release estimate and for the different stage for the period 2010-2014. This is the first time that this statistic has been calculated for Rwanda release time and is rarely computed in time release studies. It contains valuable information and can assist in focusing on problem areas in the release process. The standard deviation statistics reflect how representative the calculated averages are for the population of release times of the data set. It informs us that 78.2 per cent of all observations fall within one standard deviation. For instance if the average time it takes between acceptance and release is 483 minutes and the standard deviation is 1118 minutes (Q4, 2014) it means that in the frequency distribution of this statistic, many more observations are to the right (more time) of the average than to the left (less time). In other words, the median time at this segment of the release process takes much longer than the average. Instead of the average 483 minutes, most cargo is held up for much longer times at this stage, even days. Table CS1.3 shows that the standard deviations are very high at all stages of the clearance process. Only at the acceptance to release stage did the standard deviation drop between 2010 and 2014, while it increased at the stage of payment to acceptance.
Traders are interested not only in the average time it takes to release the goods, but also about the assurance that their time spent clearing goods is predictable. With very large standard deviations this predictability is undermined, and traders need to adjust for this uncertainty by building up larger inventory levels, which can be costly. Figure 2 in the body of the text provides a visual presentation of the release times for different stages of the customs clearance process.
The significant standard deviations are caused by a number of factors. Traders may delay payments for a variety of reasons, while operational issues on the RRA side may result in delays. On the RRA side, one of the major causes of the large levels of standard deviation results from the inspection process and risk assessment system. Goods which must go through the red channel (high risk) require significantly more time than goods through the green channel, which tend to be released very quickly.
The percentage of cargo inspected through the red channel has remained largely constant since 2010, at about one quarter of total imports (see table SC1). In early 2014, the inspection of these goods took 29 per cent longer than for cargo inspected through the yellow channel and 275 per cent longer than for cargo classified as blue. Green channelled cargo is released even faster than the blue, as it undergoes no document or physical inspection. One method to reduce the release time as well as the standard deviation for release time is for the RRA and the relevant OGAs23 to critically review the need to physically inspect the large share of cargo they do inspect.
The initiative of the RSB to request that certain goods require a Certificate of Conformity from SGS before departing the country of origin will reduce the share of cargo that undergoes physical inspections upon arrival in Rwanda. However so far data suggest that the intensity of the RSB inspections is increasing, from 14 percent of all imports in 2012 to 43 percent in 2014, while the share of cargo inspected under the red category dropped only slightly from 74 to 70 percent between 2012 and 2014. This certainly did not contribute to the reduction in overall release time and prevented standard deviations to fall. RSB representative disputed the data provided by RRA and suggested much lower rates on inspection and lower shares of goods channelled through the red channel. In its comments to this analysis from RRA RSB also noted that it started to reduce inspection for reliable traders—a program that would appear to mirror the RRA program of Authorized Economic Operators that was rolled out on a small scale in mid-2014– program. Such a practice would tend to reduce rather than increase the rate of inspection or at least reduce the time it takes to inspect cargo. RSB also noted that the increase in its inspection rate follows the recruitment of more staff that permits it to better undertake its mandate of consumer protection and monitor trade at more borders.


